
Cardano Price Warning: Inverse Cup & Handle Pattern Signals 46% Crash Risk Amid Declining Active Users
A rare inverse cup-and-handle chart pattern and falling active user count could drive Cardano (ADA) down as much as 46%. Learn why technical and on‑chain signals point to a bearish outlook.
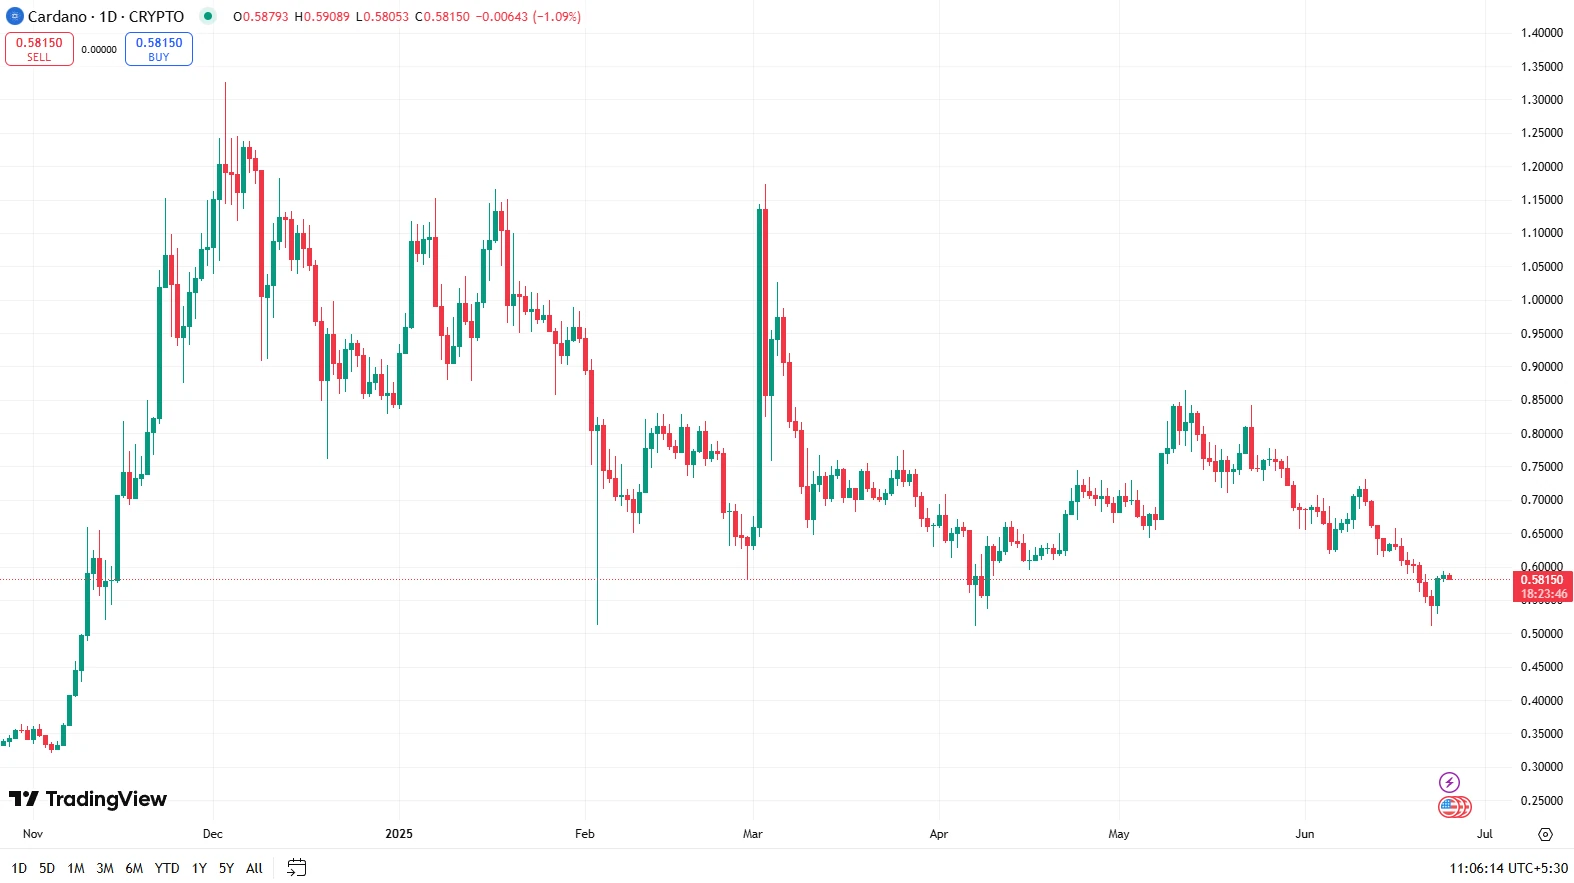
1. Inverse Cup‑and‑Handle Pattern Emerges
Technical analysis highlights the development of a rare inverse cup‑and‑handle pattern on ADA’s daily chart. Typically considered a strong bearish signal, this pattern often precedes a sharp decline in asset prices, putting pressure on ADA’s $0.58 range.
2. Death Cross Adds to Bearish Outlook
Alongside the inverse cup‑and‑handle, ADA has also formed a death cross—where the shorter-term moving average crosses below the longer-term one. This combination amplifies downside risk and increases the likelihood of a pullback toward lower support zones.
3. Active User Decline Weakens On‑Chain Fundamentals
On‑chain metrics reveal a drop in the number of daily active users interacting with Cardano. Declining network usage often indicates weaker demand, reinforcing the negative impact of bearish technical patterns.
4. Price and Volume Snapshot
At the time of analysis, ADA is trading near $0.58, with a 24-hour trading volume around $1.24 billion. While market-wide rallies have offered brief respite, the combined technical and on‑chain signals suggest these gains are vulnerable.
5. Potential 46% Downside Target
If the inverse cup‑and‑handle plays out fully, ADA could see a retracement of nearly 46%, potentially falling to ~$0.32. This aligns with both chart pattern projections and recent support breakouts.
Summary: Why the Outlook for ADA Turns Bearish
Factor | Implication for ADA |
|---|---|
Inverse cup‑and‑handle chart | Indicates strong downward momentum |
Death cross formation | Signals trend reversal |
Declining active users | Reflects weakening fundamentals |
$0.32 potential target | Possible downside of ~46% |
These overlapping signals suggest that despite short-term rebounds, Cardano is strategically vulnerable. Traders and investors should monitor key support levels, on‑chain activity, and broader market conditions.
Final Take
With both technical charts and on‑chain analytics signaling downside risk, ADA appears poised for a significant correction. A 46% drop to around $0.32 is within range if support levels fail. Traders should exercise caution, tighten risk controls, and watch for a reversal in user activity to gauge potential recovery.